Introducing Sun & Space
From the sun's surface
From the sun's surface
to your street.
How much of it reached you today, and what it's doing 150 million km away.
How much of it reached you today, and what it's doing 150 million km away.
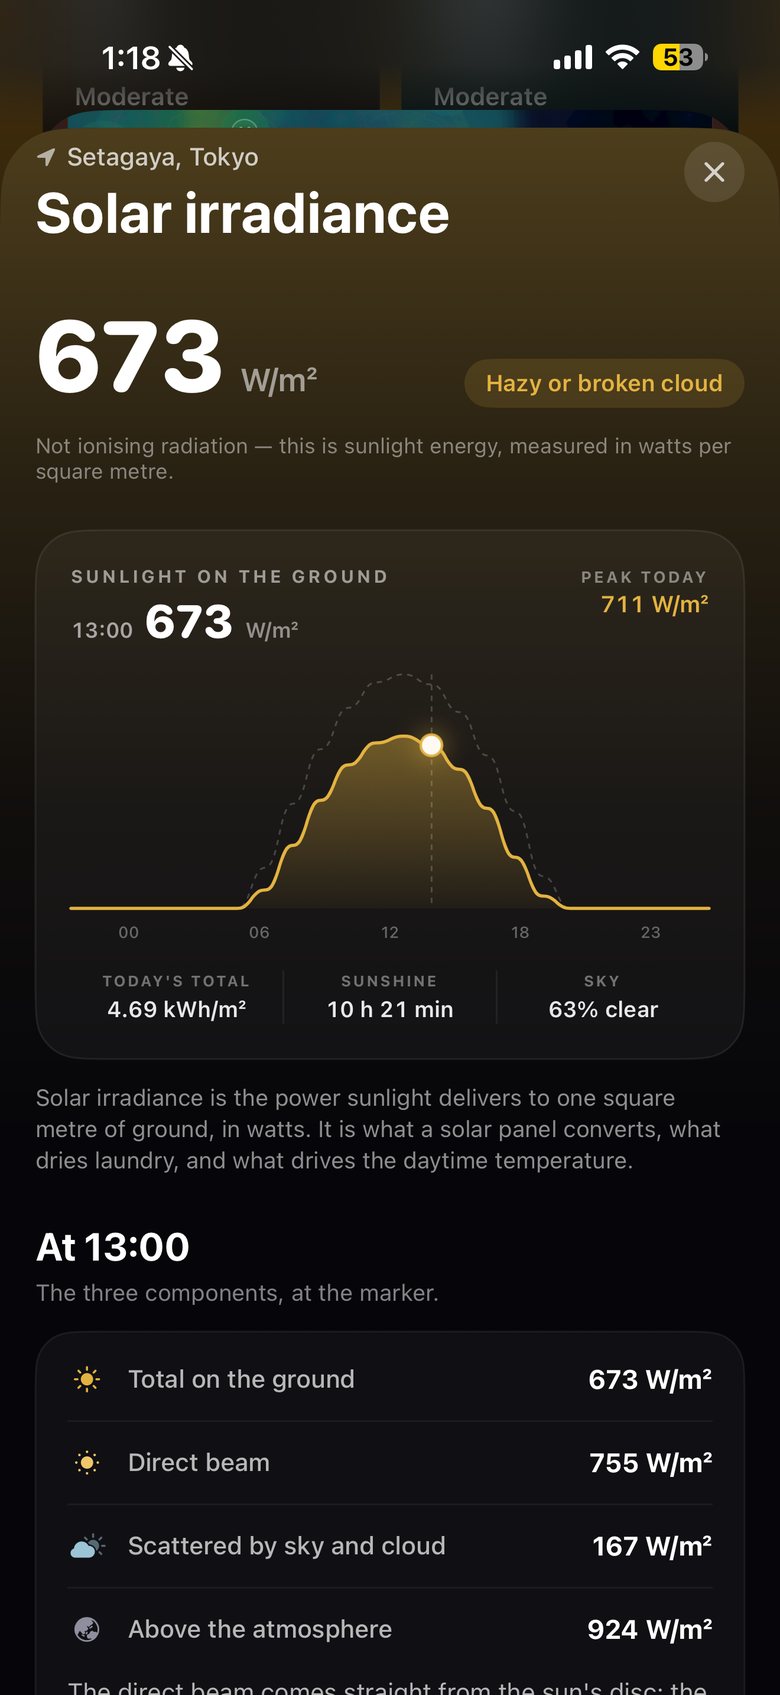
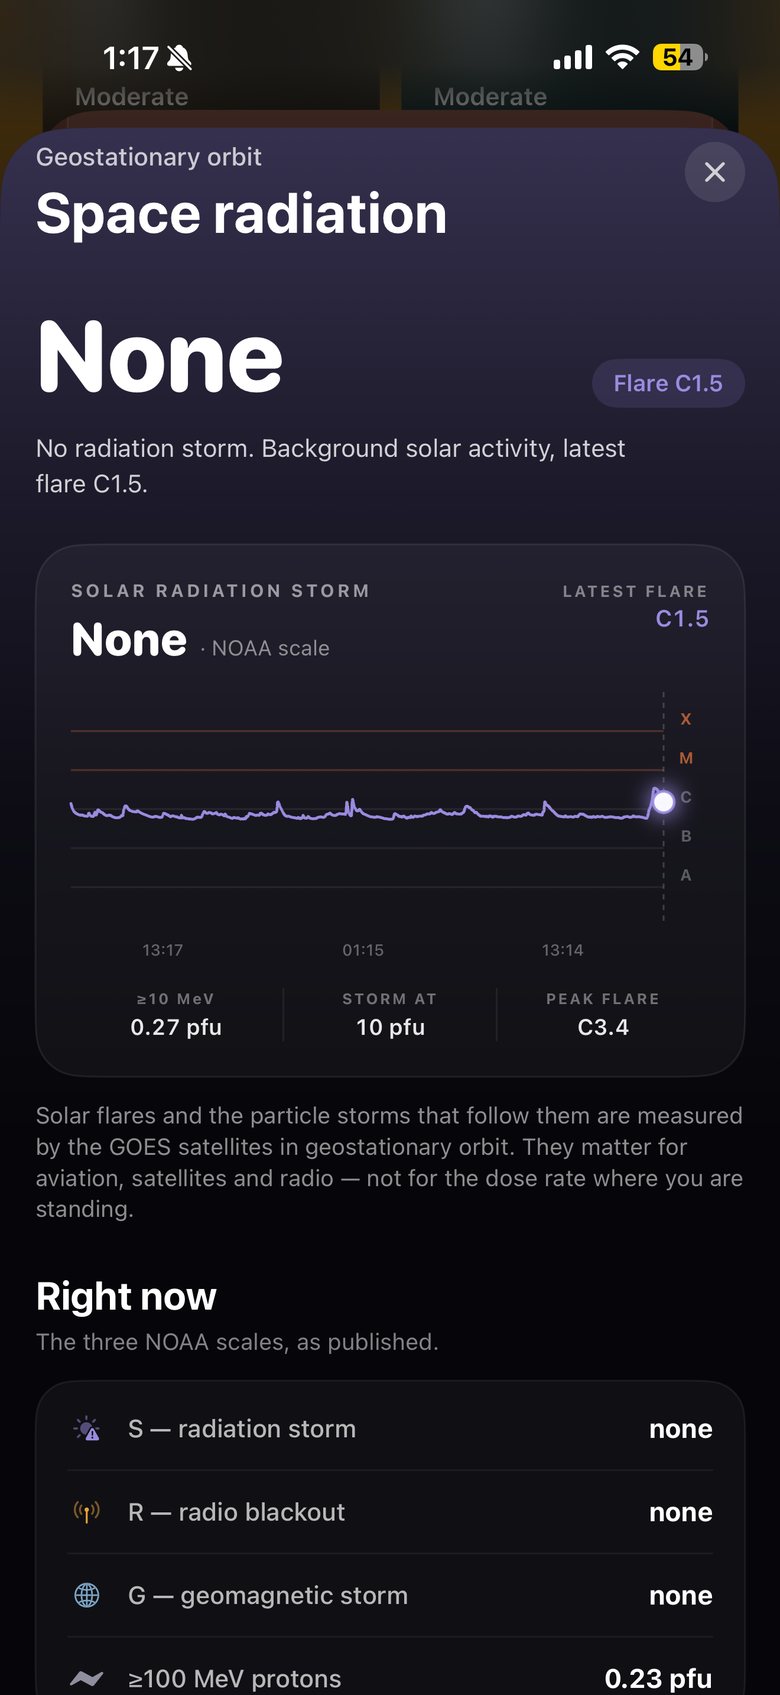
SHINDO watches the sun twice. From the ground: how much sunlight reached your street today, in watts per square metre — what dries the laundry, powers the solar panels and drives the afternoon heat. And from orbit: the flares and particle storms NOAA's GOES satellites measure 36,000 km up, on the three official NOAA scales, with a plain sentence on who they actually affect. Usually, it isn't you — and SHINDO says so.
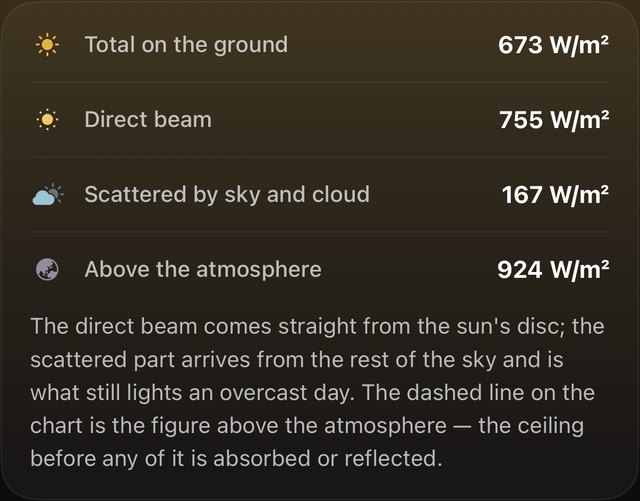
A low sun spreads one beam of light over more ground, so each square metre gets less. SHINDO splits today's sunlight into the direct beam from the sun's disc and the light scattered by sky and cloud — the two parts that add up to what reaches the ground. Drag the sun to see how the angle alone changes it.
Today's 13:00 values from the app (Setagaya, 18 October). The demo keeps the direct beam and the sky light fixed and changes only the angle; in reality a low sun also passes through more air.
SHINDO draws today's sunlight hour by hour against the ceiling above the atmosphere, then adds it up: the energy each square metre collected, how long the sun shone, and how clear the sky really was.
Clearness index is the share of the sunlight above the atmosphere that reached the ground: about 0.7 and above is a clear day, 0.25 and below heavy overcast. Curve redrawn from the app's chart for 18 October; totals as shown in the app.
Flares are classed by the X-rays GOES measures in the 0.1–0.8 nm band. They travel at the speed of light, so a flare and its radio blackout reach Earth the moment it's seen. Hold the button to grow one.
Degrades HF radio on the sunlit side of Earth. Measured as the flare's X-ray class.
Proton flux above 10 MeV; S1 begins at 10 pfu. Matters for satellites, astronauts and polar flights.
Shakes Earth's magnetic field: auroras, GPS errors and stress on power grids.
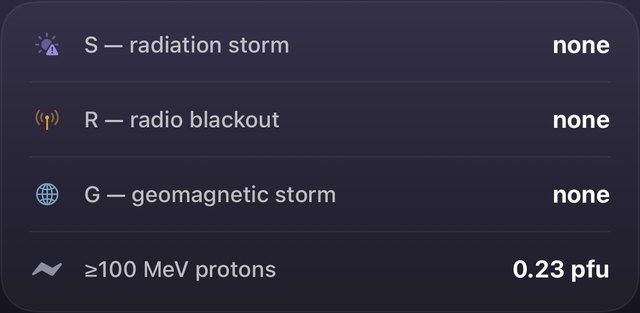
A solar radiation storm does not raise the dose rate where you are standing. Earth's magnetic field turns the particles away from mid-latitudes like Japan and the atmosphere absorbs the rest. Who it does reach: astronauts, satellites, and crews and passengers on polar flights. Raise the storm and watch.
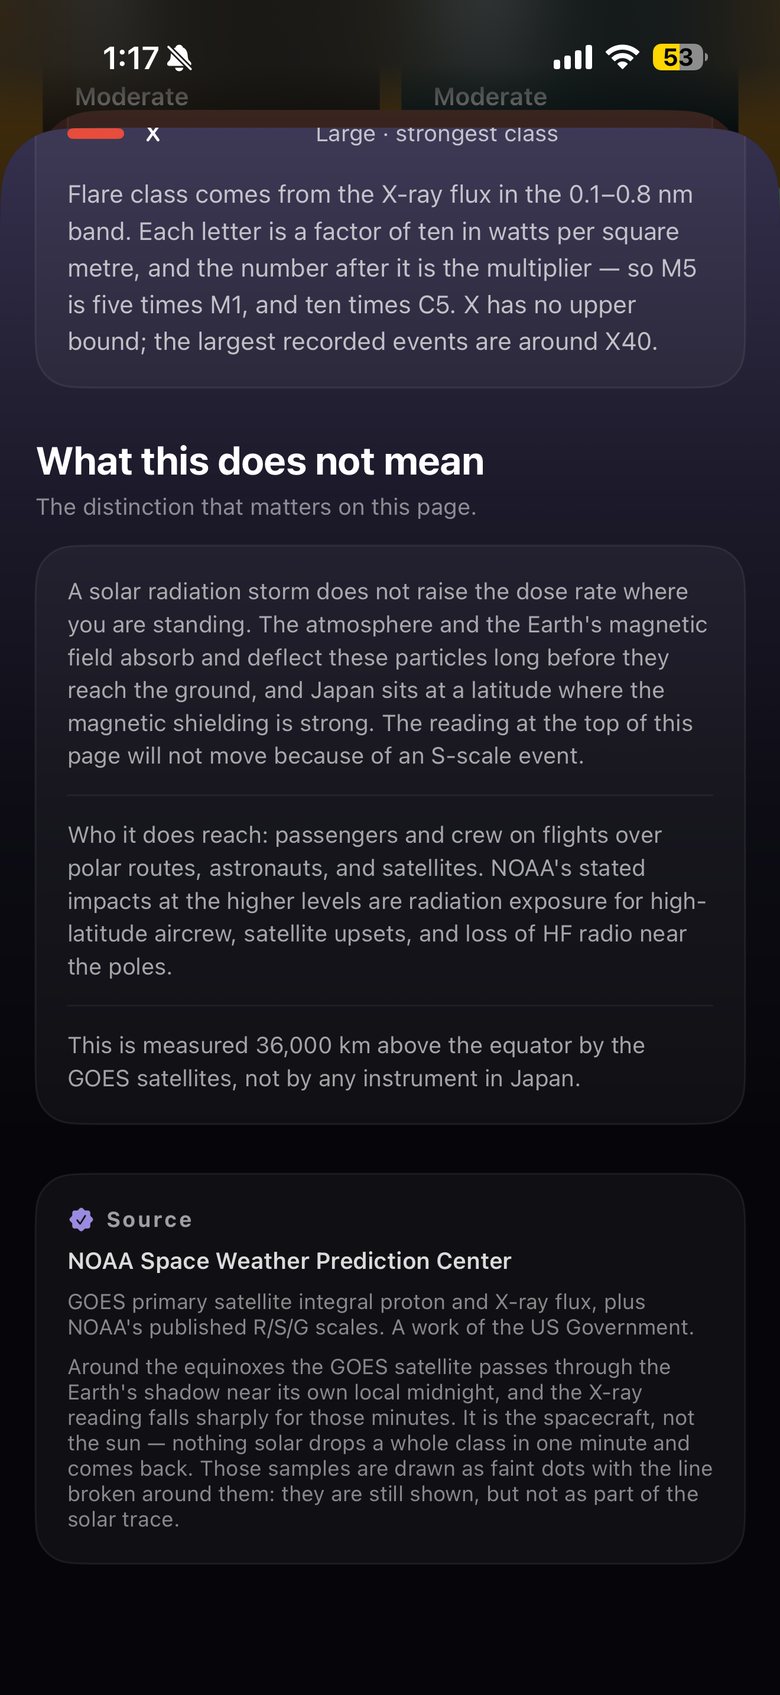
Around each equinox, GOES passes through Earth's shadow near its local midnight, for up to 72 minutes, and its X-ray reading drops sharply. Nothing on the sun drops a whole class in a minute and comes back — so SHINDO draws those samples as faint dots and breaks the line around them, instead of showing you a flare that never happened.
Eclipse seasons: roughly late February to mid-April and late August to mid-October (NOAA OSPO). Not to scale in time — the year speeds up outside the eclipse seasons.

Space weather: NOAA Space Weather Prediction Center — GOES primary-satellite integral proton flux and X-ray flux, and NOAA's published R, S and G scales (a work of the U.S. Government). Radio-blackout effects paraphrased from the NOAA Space Weather Scales. Solar irradiance: Open-Meteo.com (CC BY 4.0); hourly values are averages over the preceding hour, and the above-the-atmosphere figure is an astronomical calculation, not a measurement. GOES eclipse seasons after NOAA's Office of Satellite and Product Operations.
Screens show the SHINDO app on 18 October 2026, about 1:17 PM, Setagaya, Tokyo. Interactive demos on this page are illustrations, not live data. SHINDO is not affiliated with or endorsed by NOAA. All data sources.