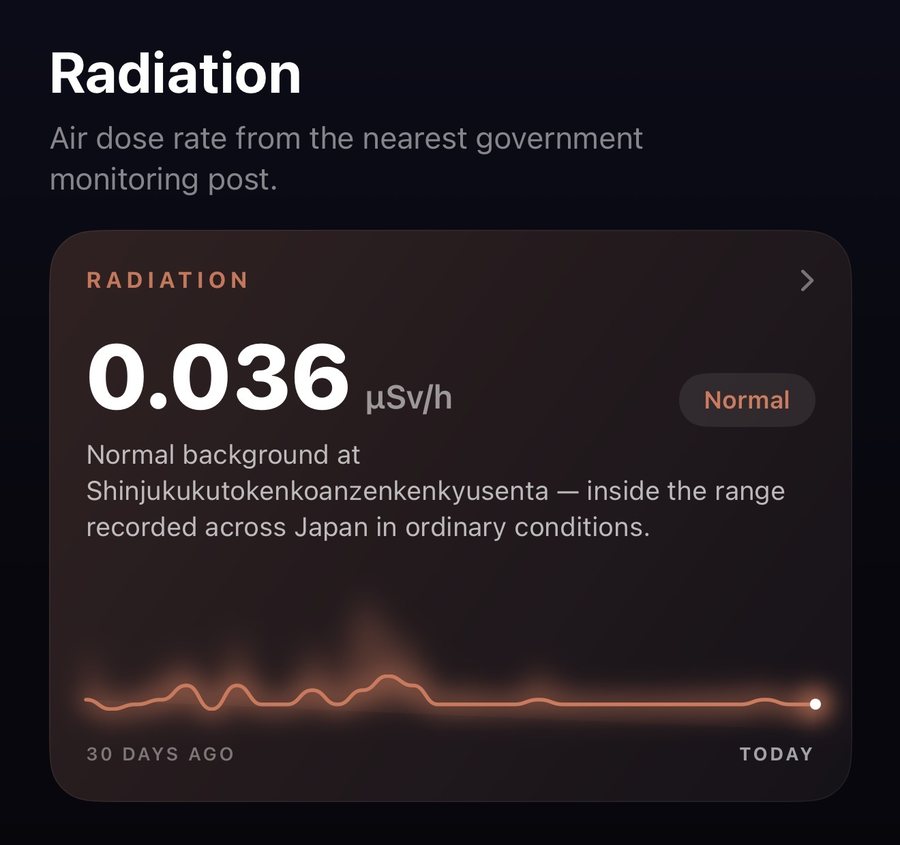
It finds your nearest post. SHINDO locates the government monitoring post closest to you and shows its latest reading, its distance and when it was measured.
Introducing Radiation
Japan measures radiation around the clock.
SHINDO's radiation module reads the Nuclear Regulation Authority's national network of more than 1,000 monitoring posts, finds the instrument nearest to you, and says in plain words what the number means. Thirty days of history, a live map of the whole country, seawater and food testing around Fukushima, and space weather from NOAA — each from its official source, each explained. It's 2026. Radiation shouldn't need a physics degree.
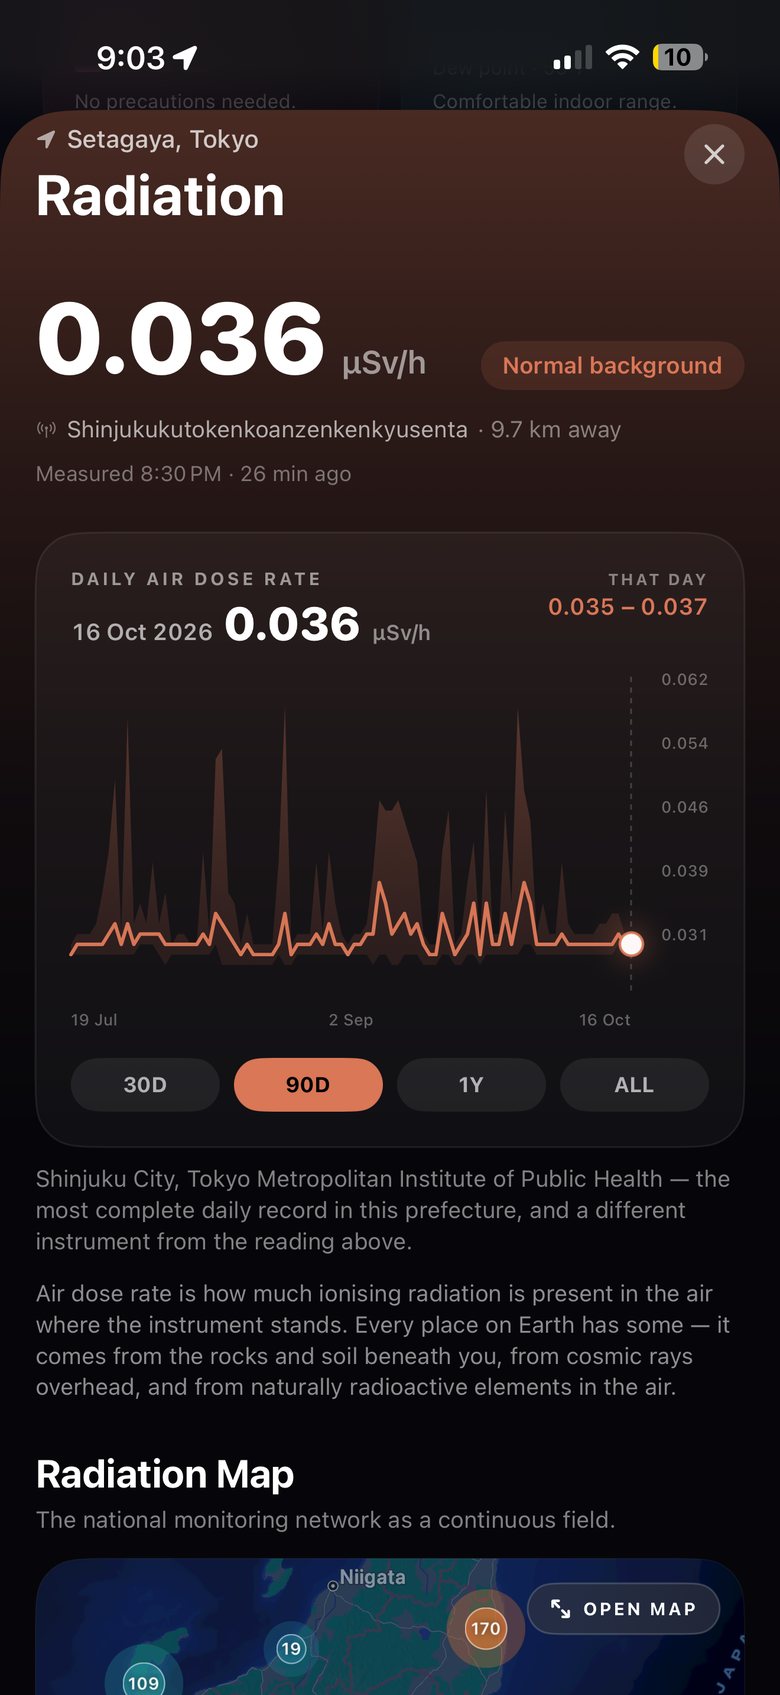
Normal background.
9.7 km from you.
Inside Japan's typical range.
SHINDO shows official measurements for information only. It is not a dosimeter, and guidance from the Nuclear Regulation Authority and local authorities always comes first.
It finds your nearest post. SHINDO locates the government monitoring post closest to you and shows its latest reading, its distance and when it was measured.
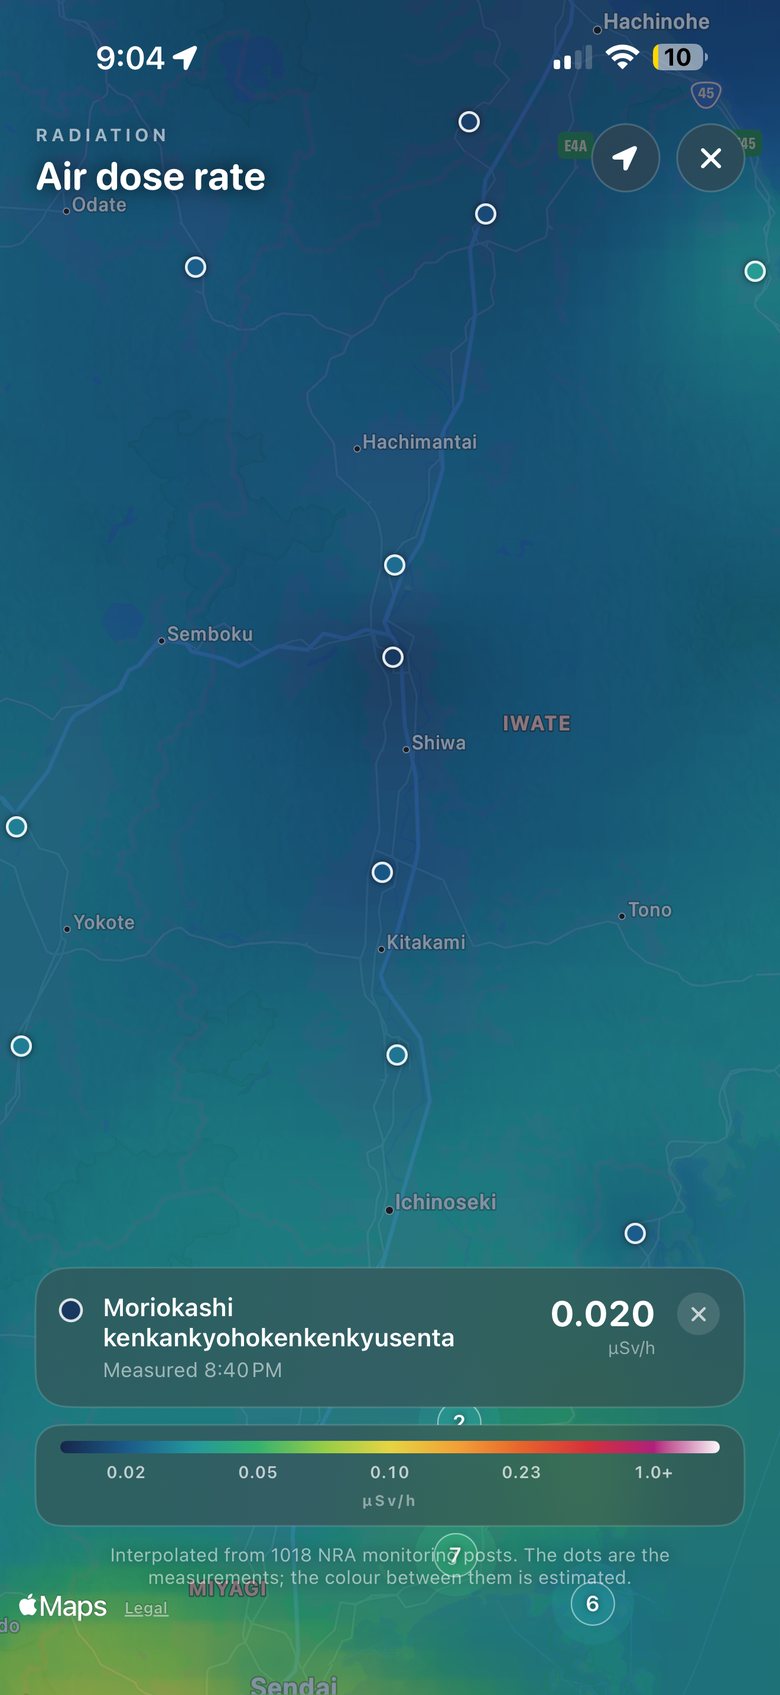
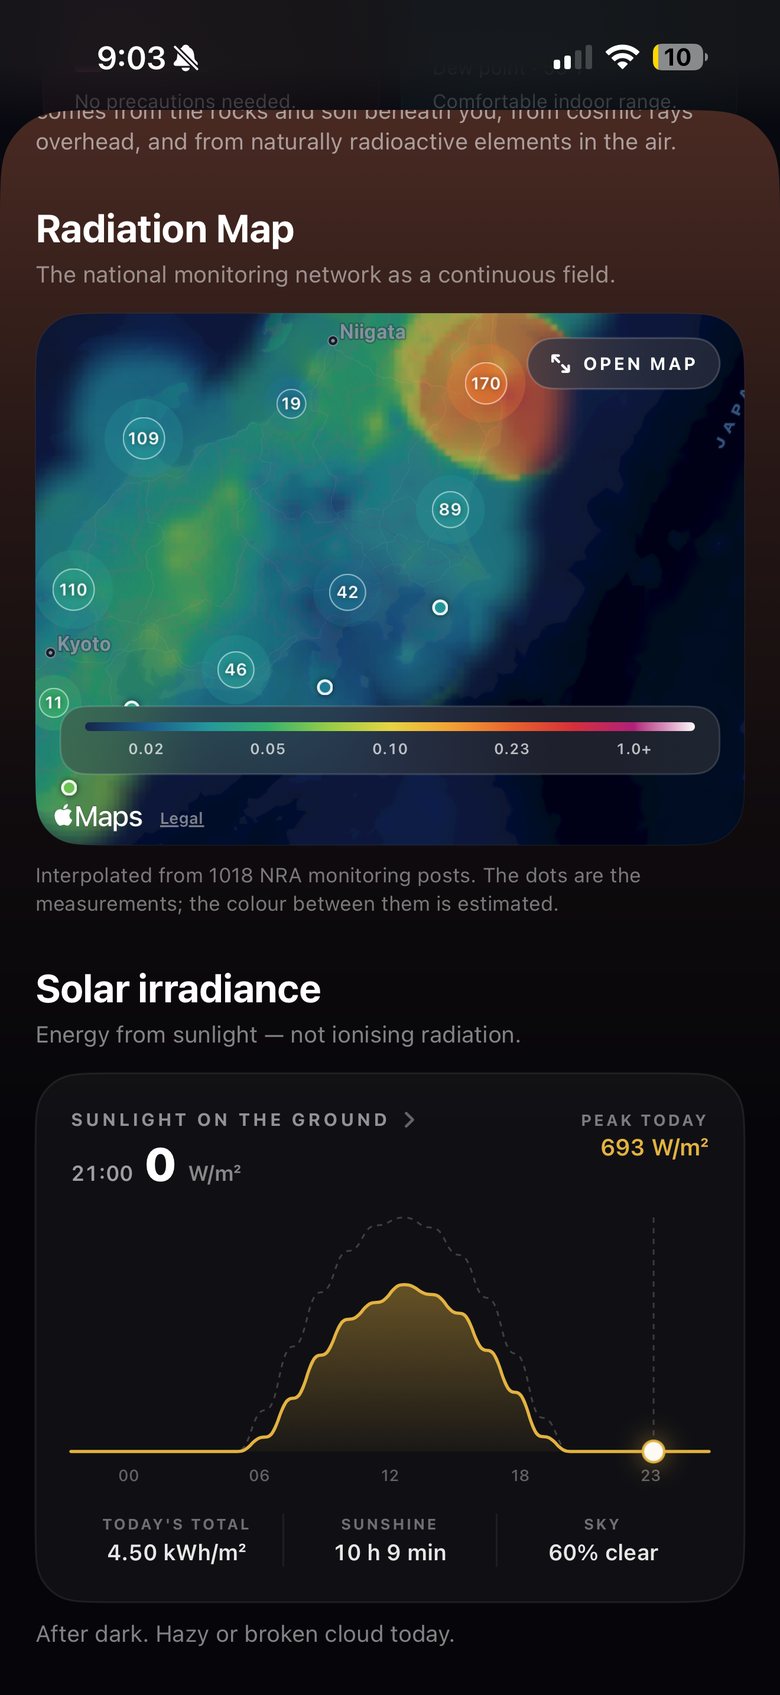
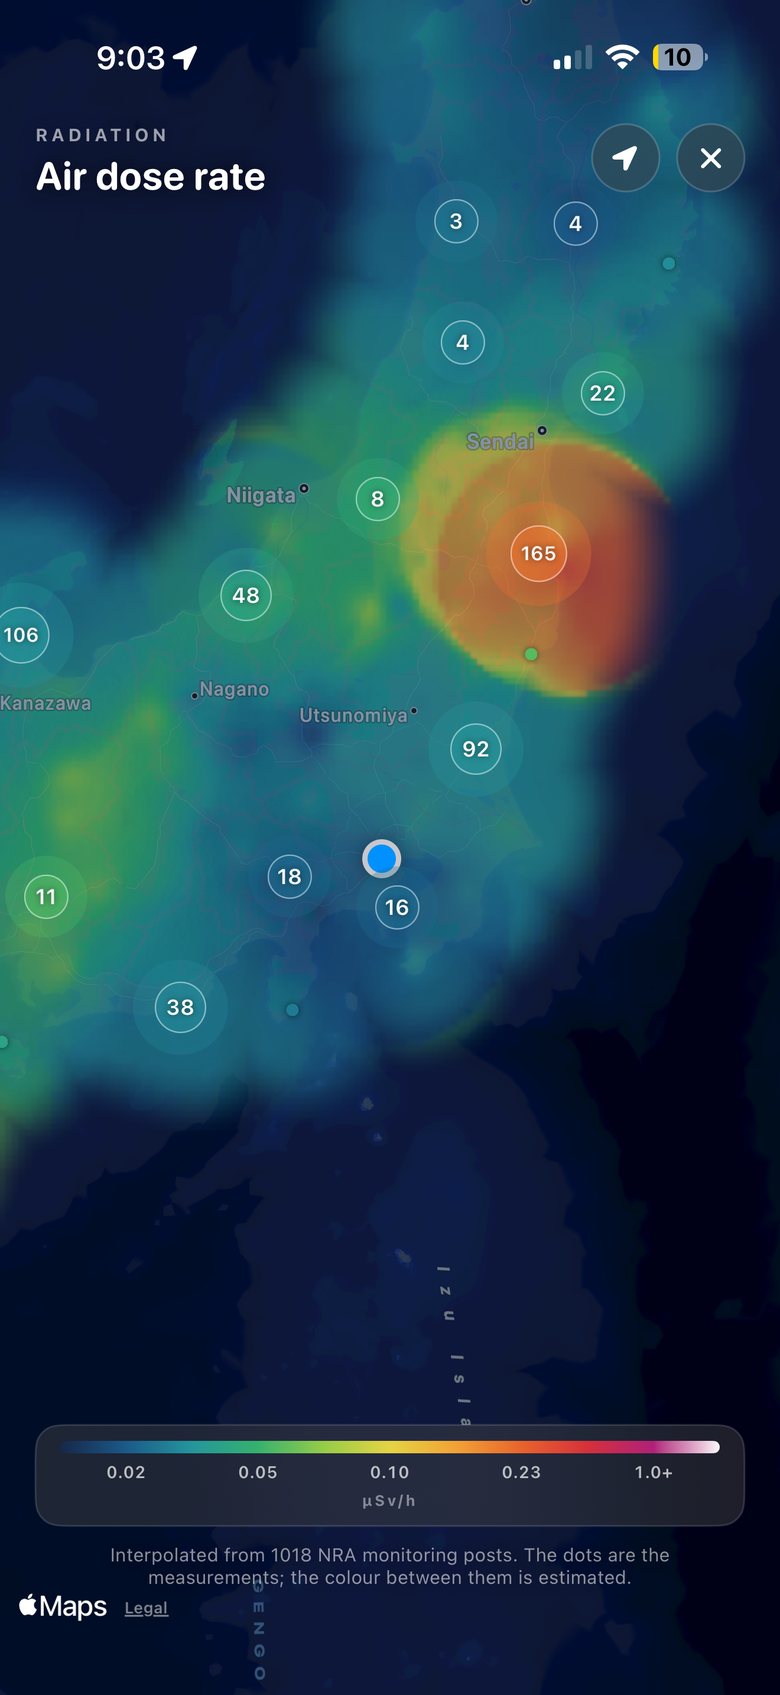
It reads the whole network. Readings from more than 1,000 NRA monitoring posts become one national map. The dots are measurements; the colour between them is labelled as estimated.
It puts today in context. Today's number sits against Japan's typical range, 30 days of history and a scale that explains what each level means.
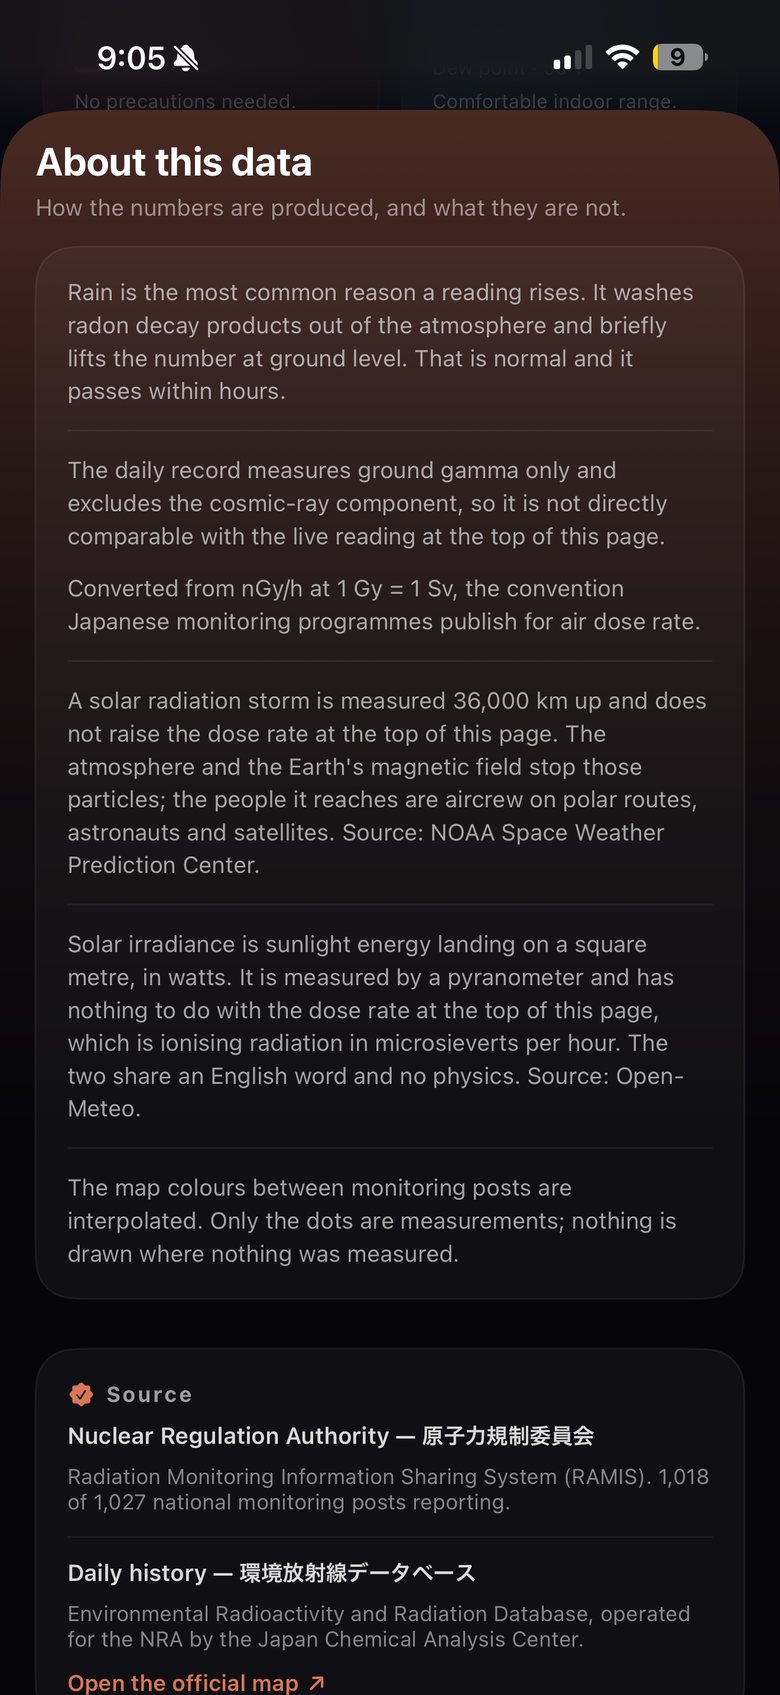
It explains the physics. Why rain lifts a reading for a few hours, why granite reads higher than sediment, and why a solar storm doesn't change the air you breathe.
The air dose rate from the nearest government monitoring post, its distance and measurement time, plus the posts around it — independent instruments you can compare at a glance.
Every reporting NRA post on one map, interpolated into a continuous field. Tap any dot for that station's own reading and time.
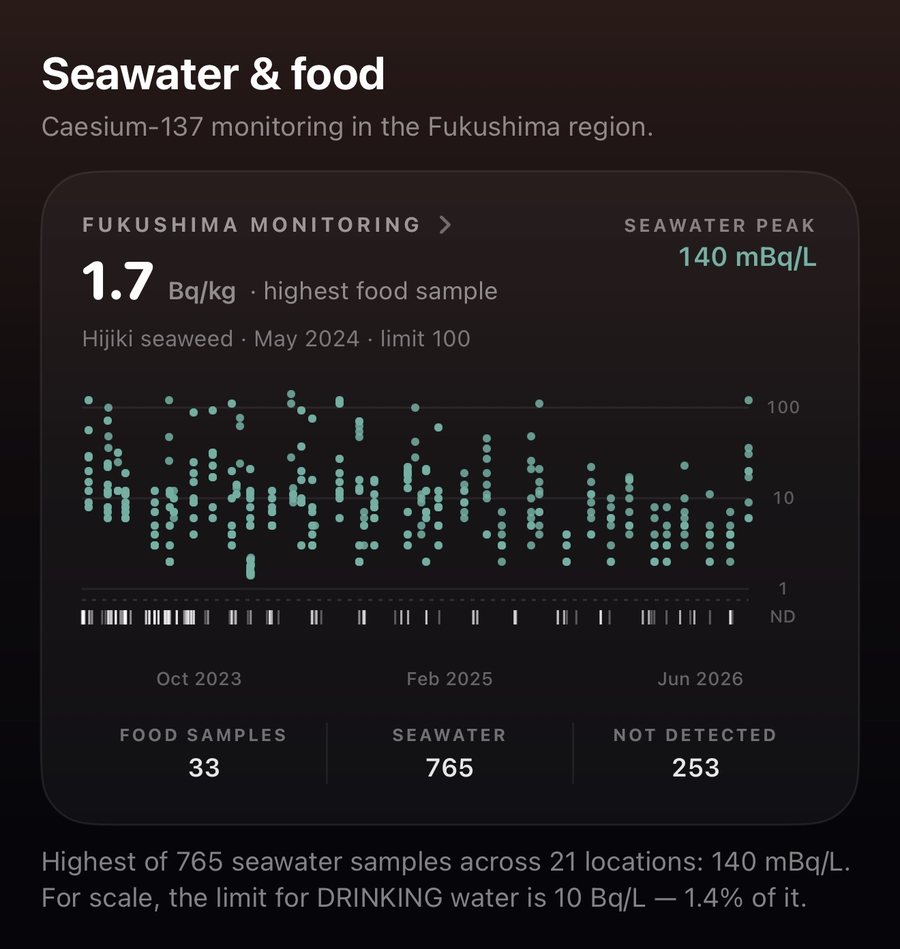
Caesium-137 in seawater and seafood from the national Environmental Radioactivity and Radiation Database, with the limit shown beside every value for scale.
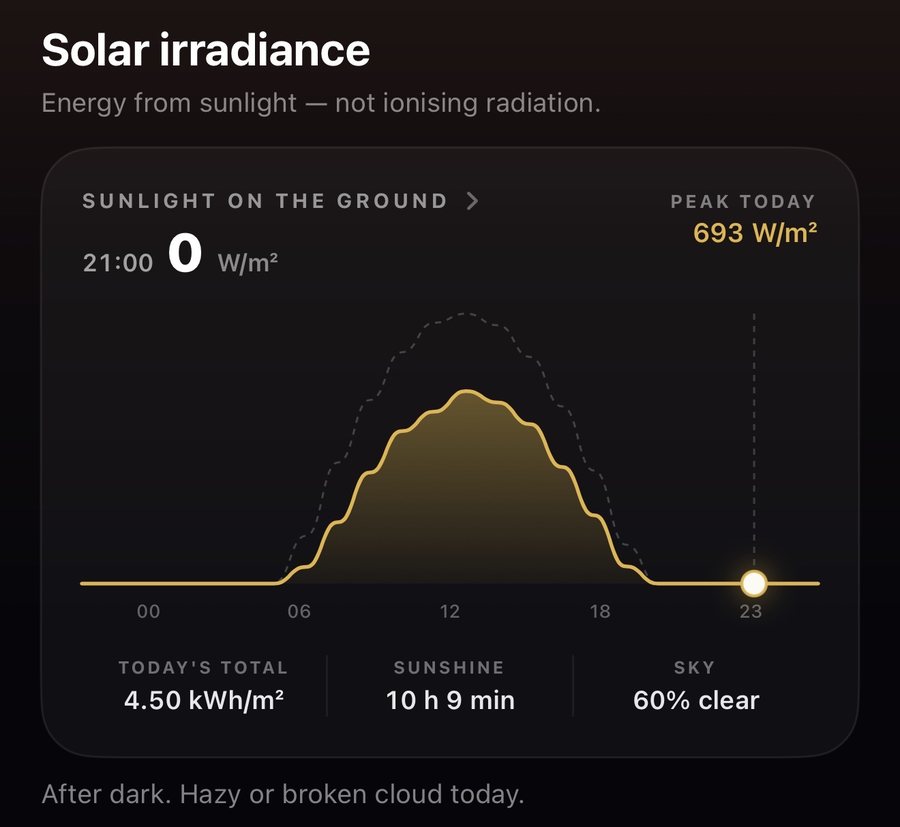
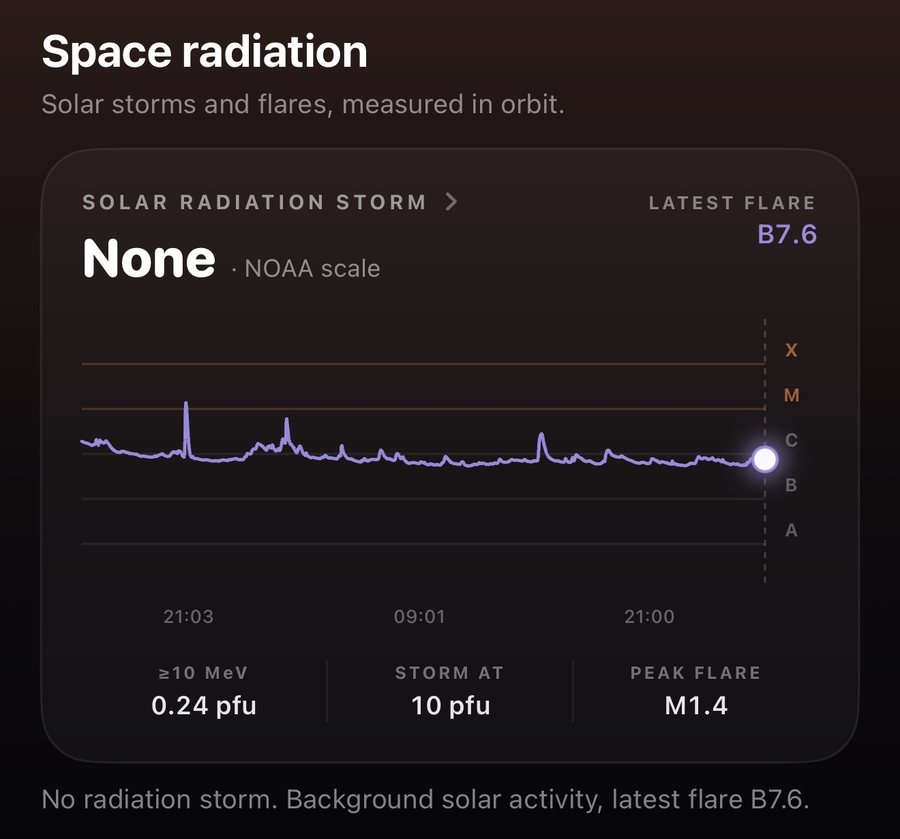
Solar radiation storms and flares from NOAA, and sunlight on the ground from Open-Meteo — kept clearly apart from the ionising radiation in the air you breathe.
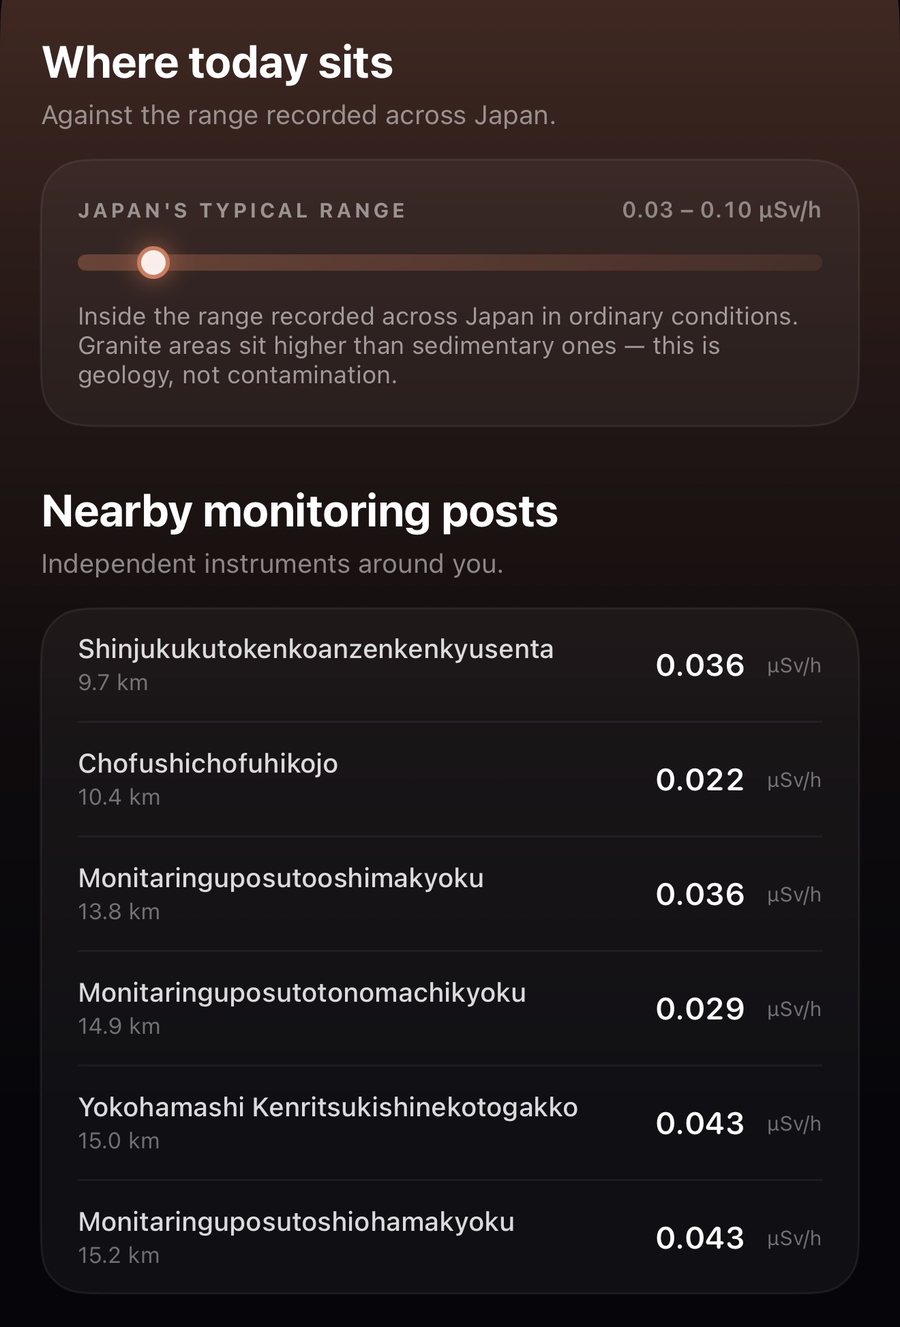
Japan's typical range and the instruments around you, so one number never stands alone.
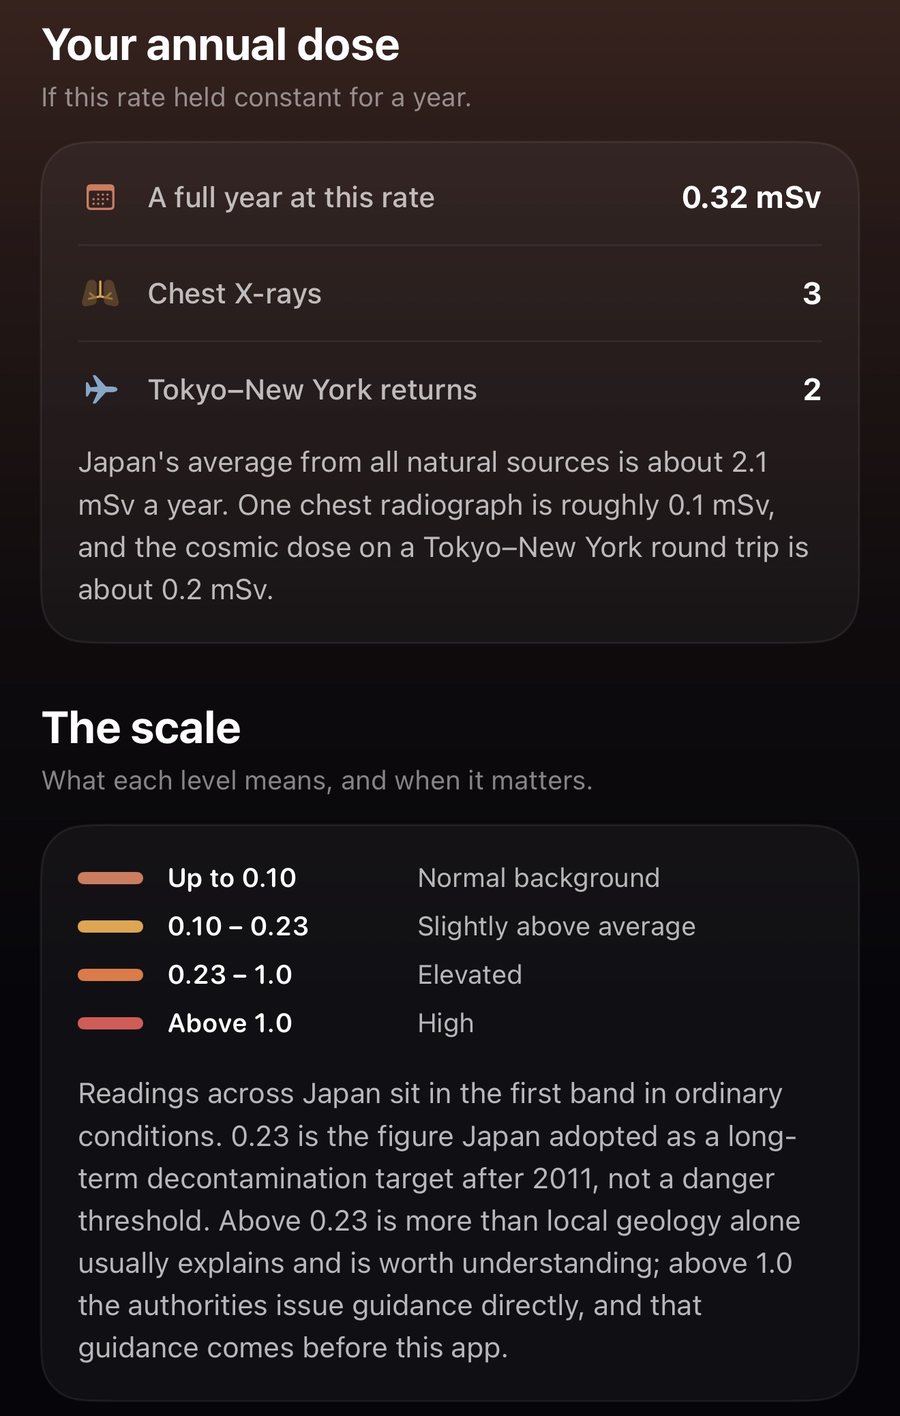
If the rate held constant for a year. For scale: Japan's average from all natural sources is about 2.1 mSv a year, one chest X-ray about 0.1 mSv, and a Tokyo–New York round trip about 0.2 mSv.
Drag the reading to see what a full year at that rate adds up to — the same maths the app uses.

Radiation readings come from the Nuclear Regulation Authority (原子力規制委員会) Radiation Monitoring Information Sharing System. 環境放射線データの情報提供:環境放射線データベース. Space weather: NOAA Space Weather Prediction Center (public domain). Solar irradiance: Open-Meteo.com (CC BY 4.0).
Screens show the SHINDO app on 17 October 2026 in Setagaya, Tokyo. Map colours between monitoring posts are interpolated; only the dots are measurements. SHINDO is an information service, not a radiation measuring instrument. In an emergency, follow the instructions of the national government and your local authorities. All data sources.