Introducing Air & Environment
The air you breathe
The air you breathe
has a number.
Move through it. Every speck here is a particle you breathe in.
Move through it. Every speck here is a particle you breathe in.
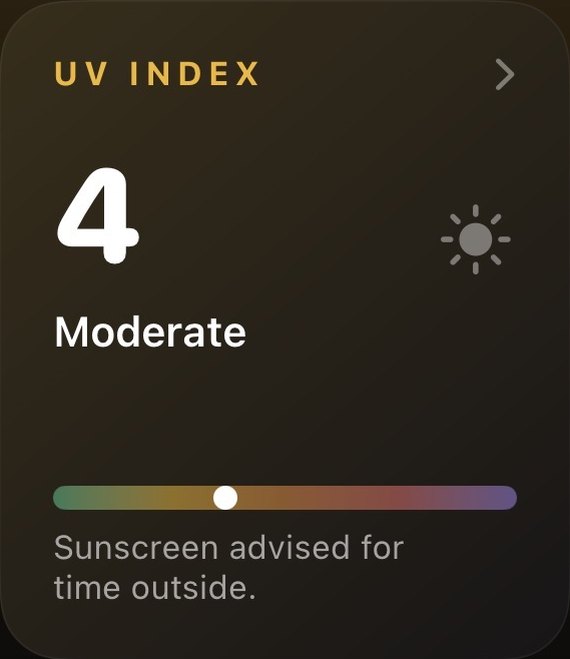
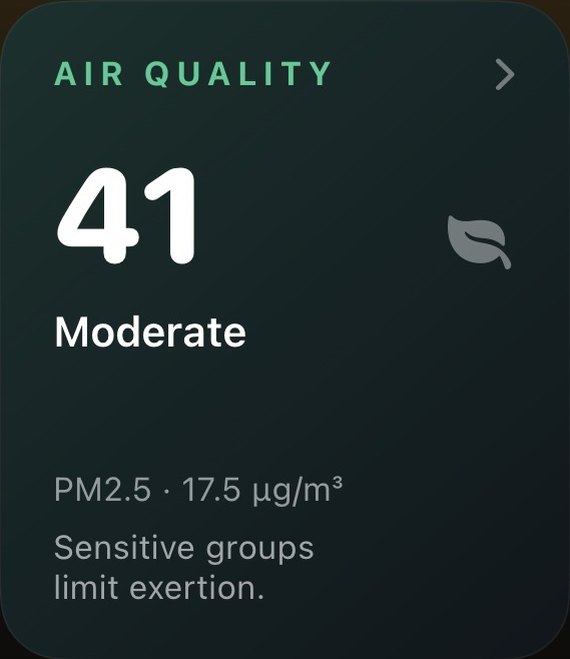
The sun, the air, the pollen and the moisture around you change every hour, and each one comes with its own scale, its own units and its own jargon. SHINDO reads them for your exact location, turns each into one number and one sentence — sunscreen or not, run outside or not, take your antihistamine or not — and tells you when the air turns poor.
PM2.5 particles are 2.5 micrometres or smaller — small enough to slip past your nose and throat and reach deep into your lungs. Keep scrolling to shrink down to their size.
Sizes to scale. Comparison after the U.S. Environmental Protection Agency's particle-size illustration.
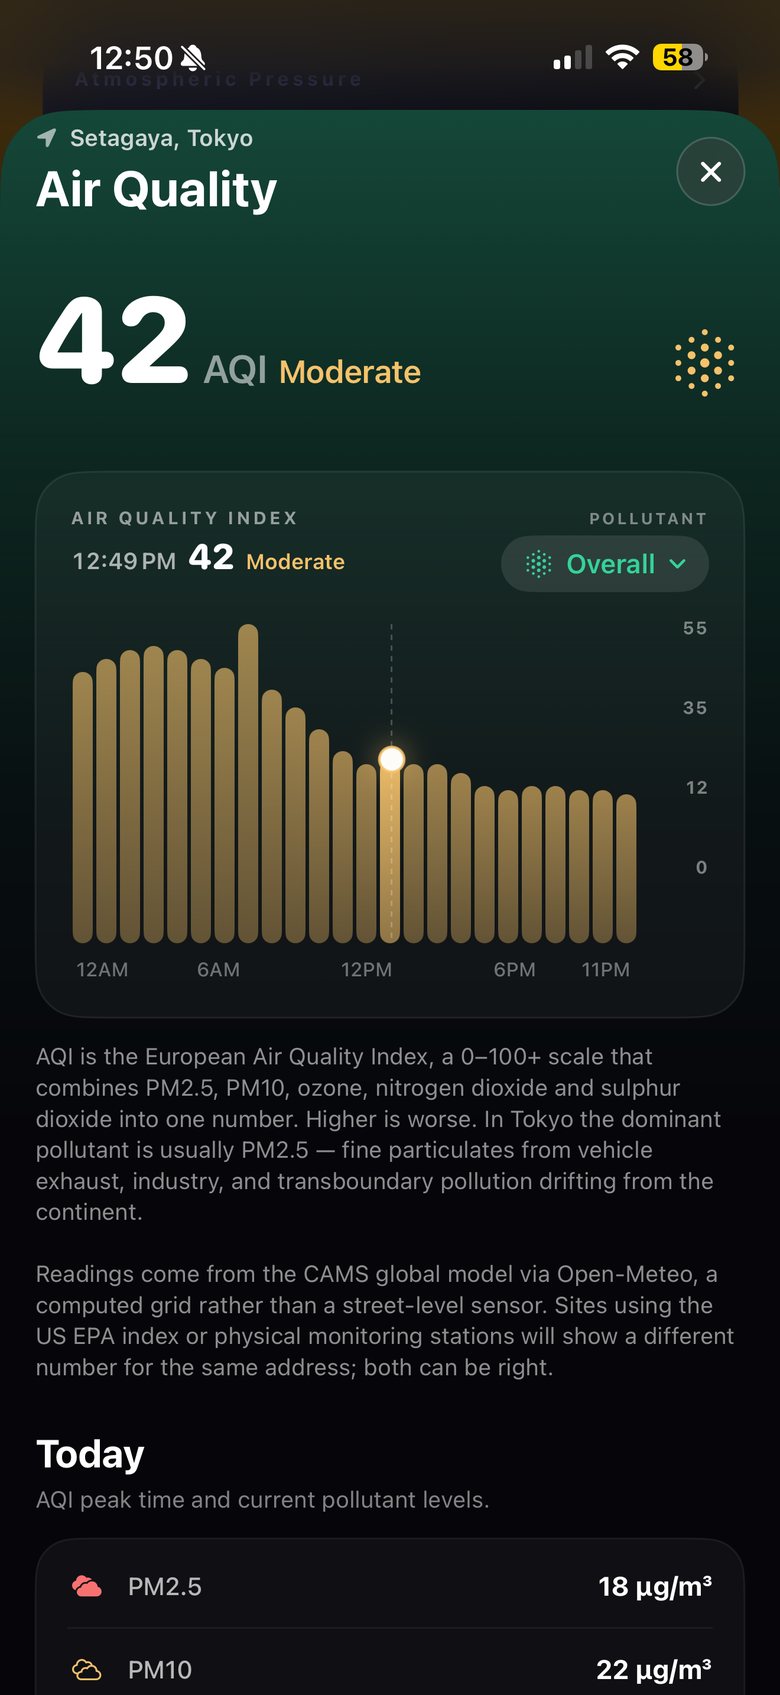
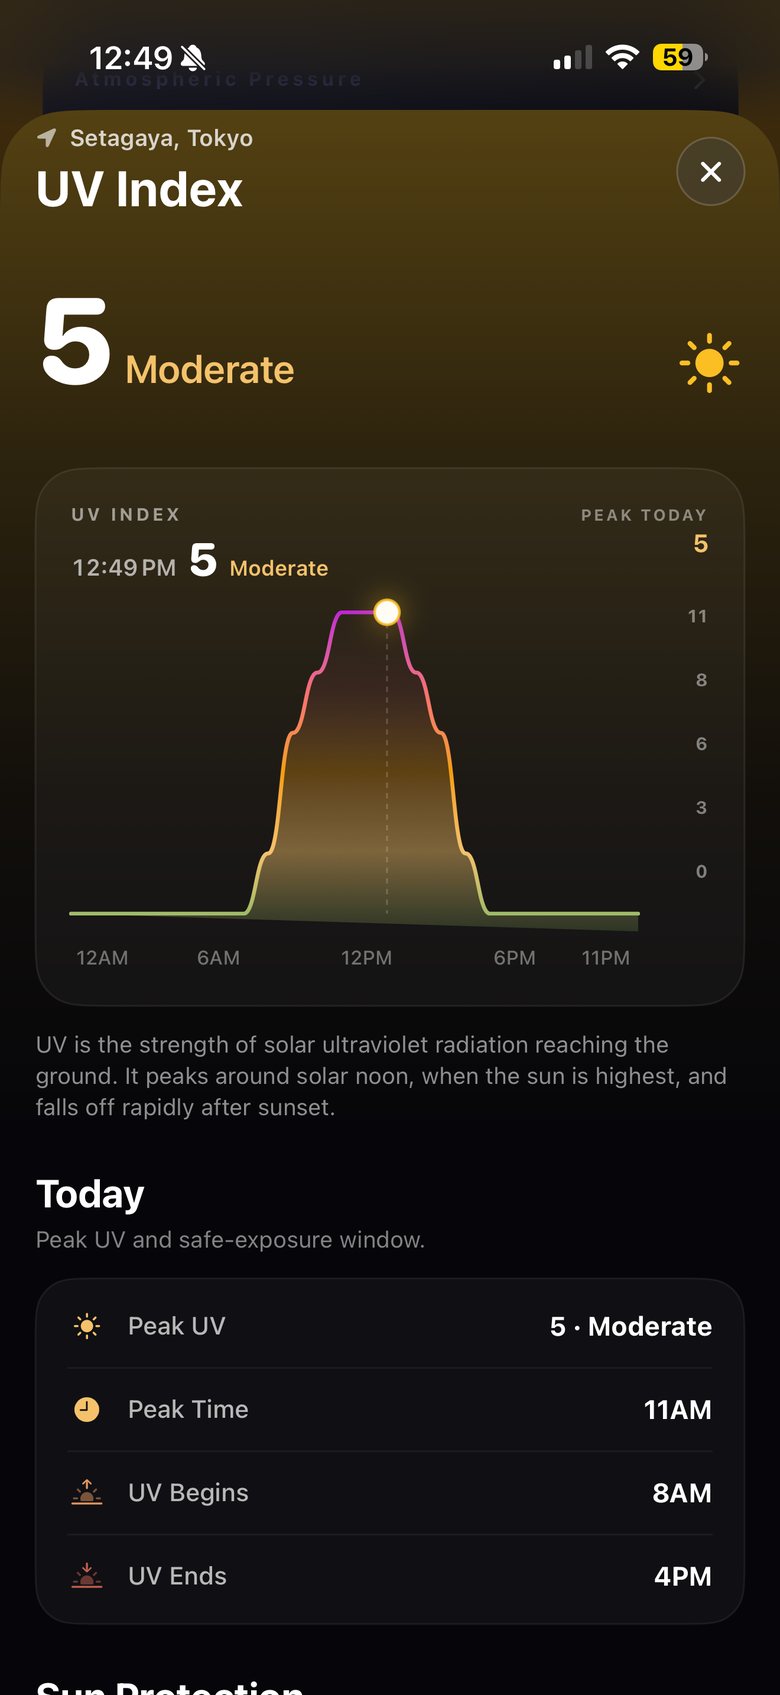
Values as shown in the app at 12:49 PM on 18 October 2026, Setagaya. Each pollutant gets its own chart style, so you never confuse one for another.
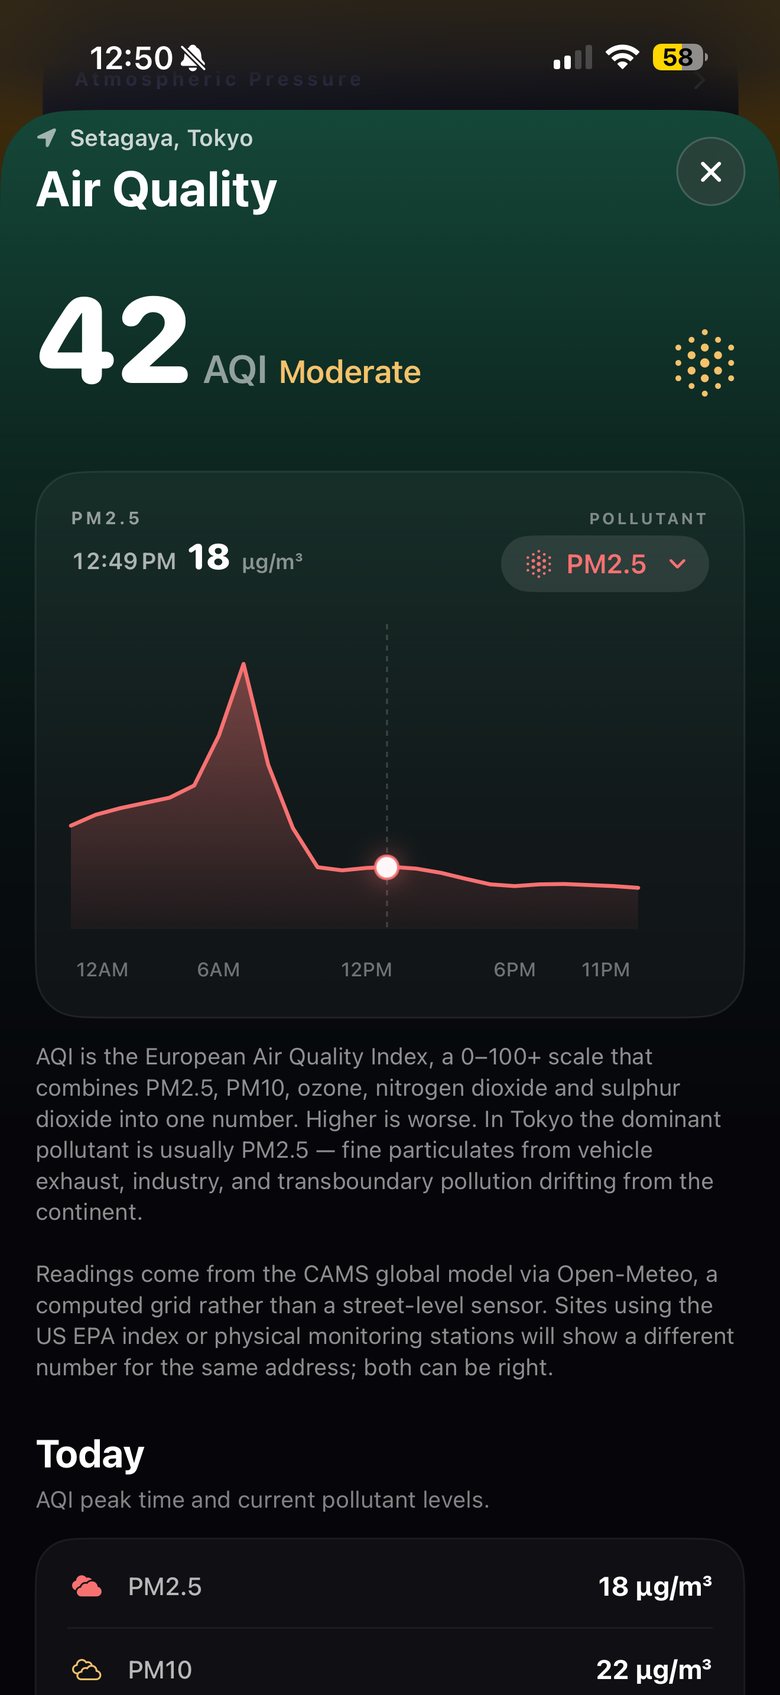
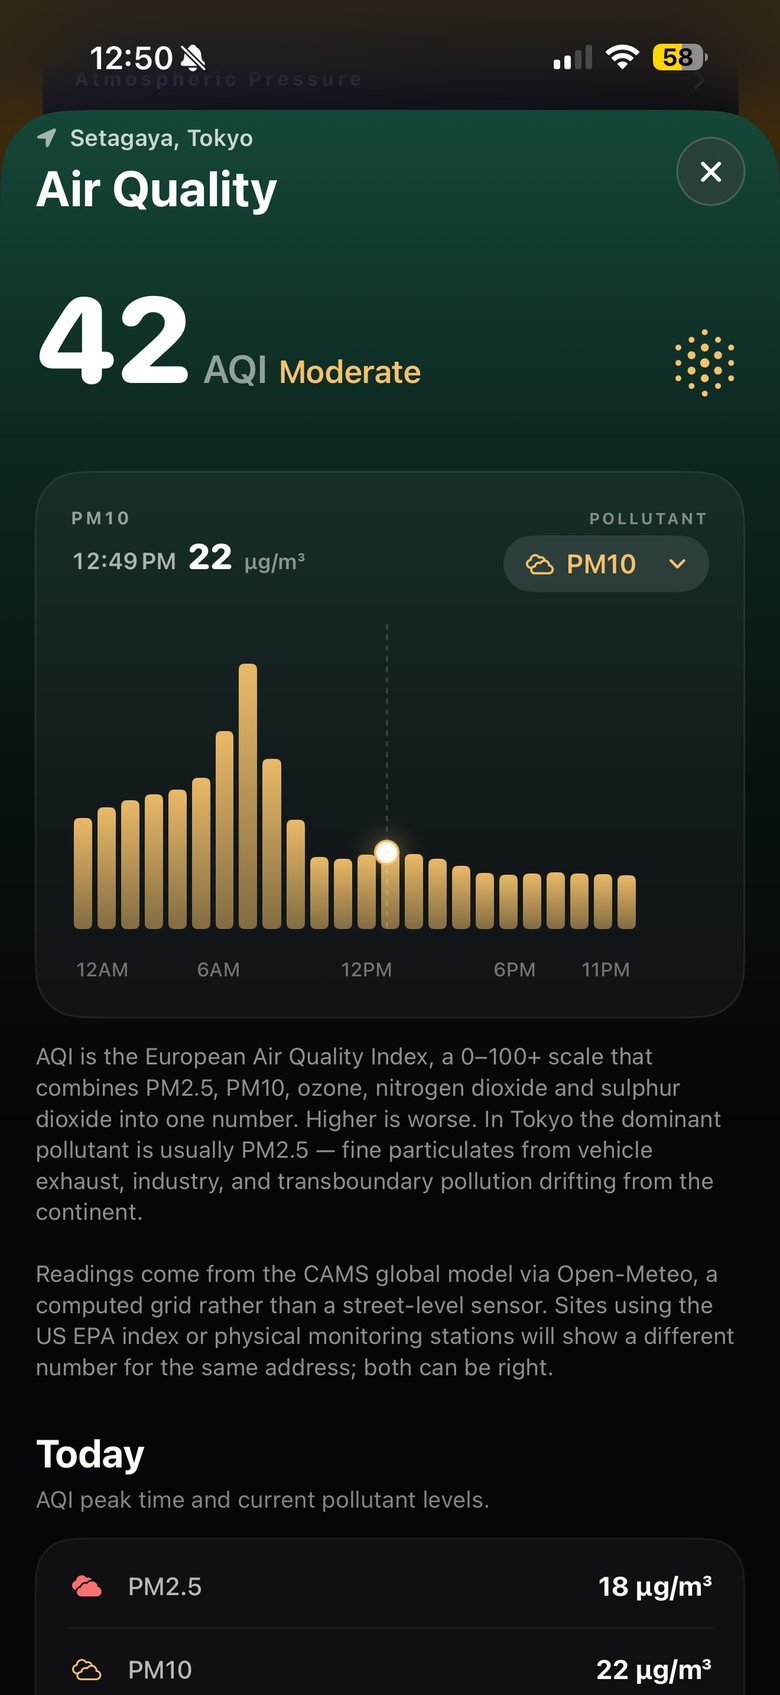
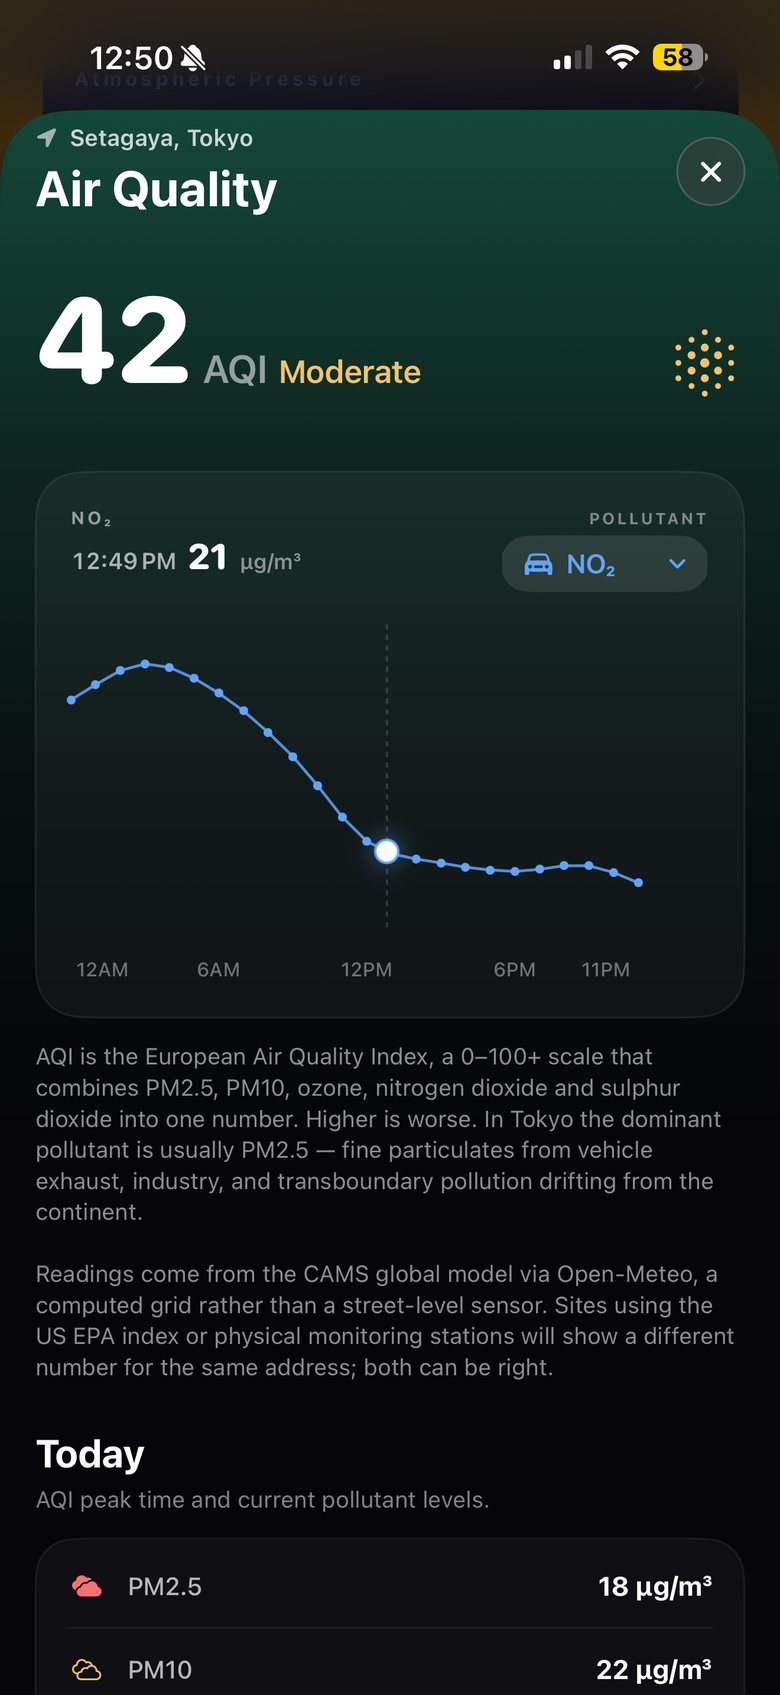
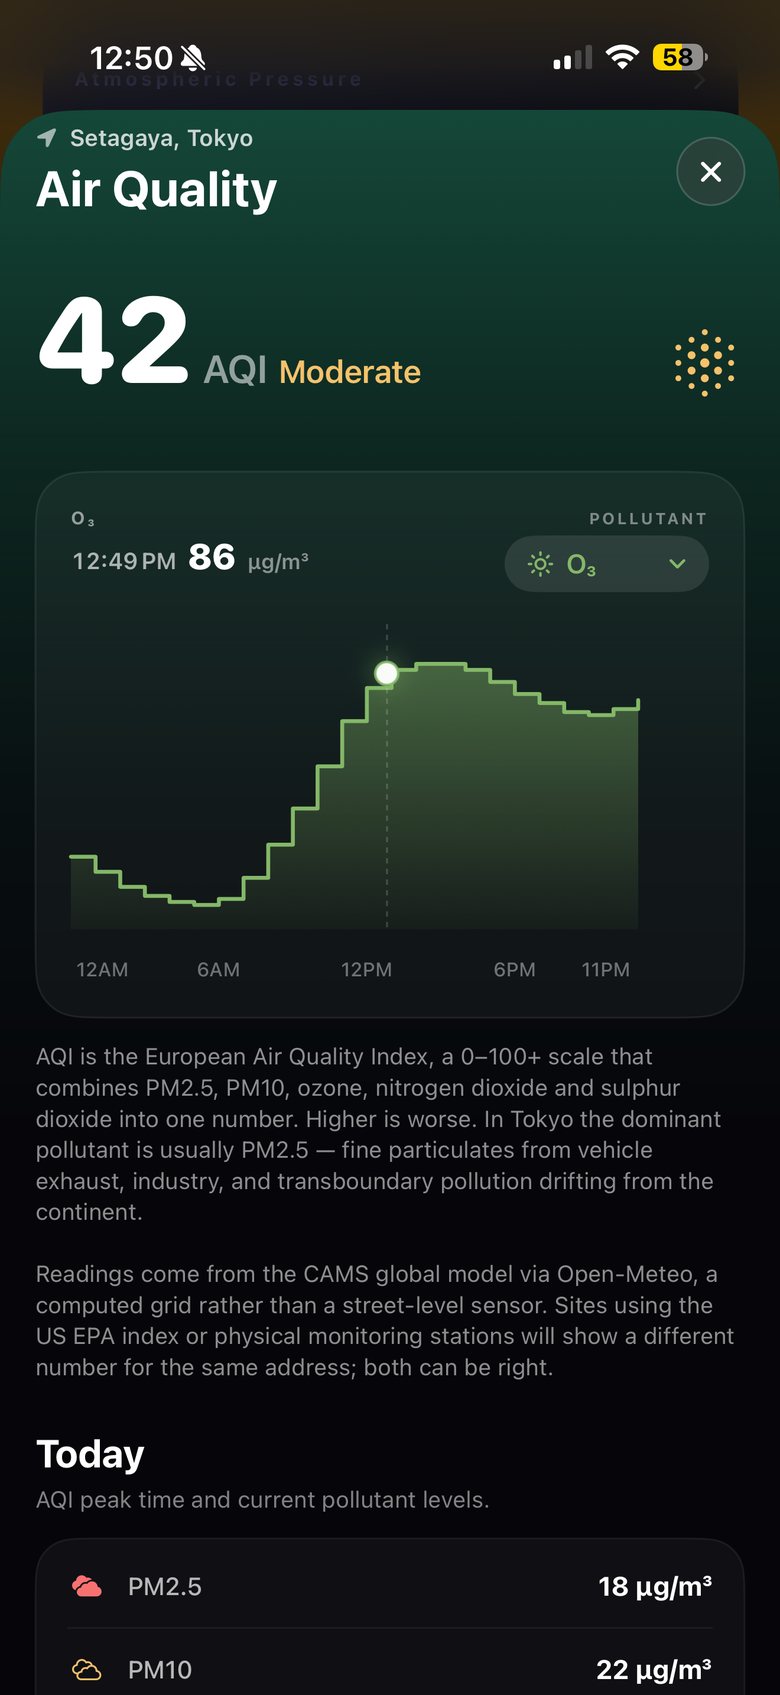
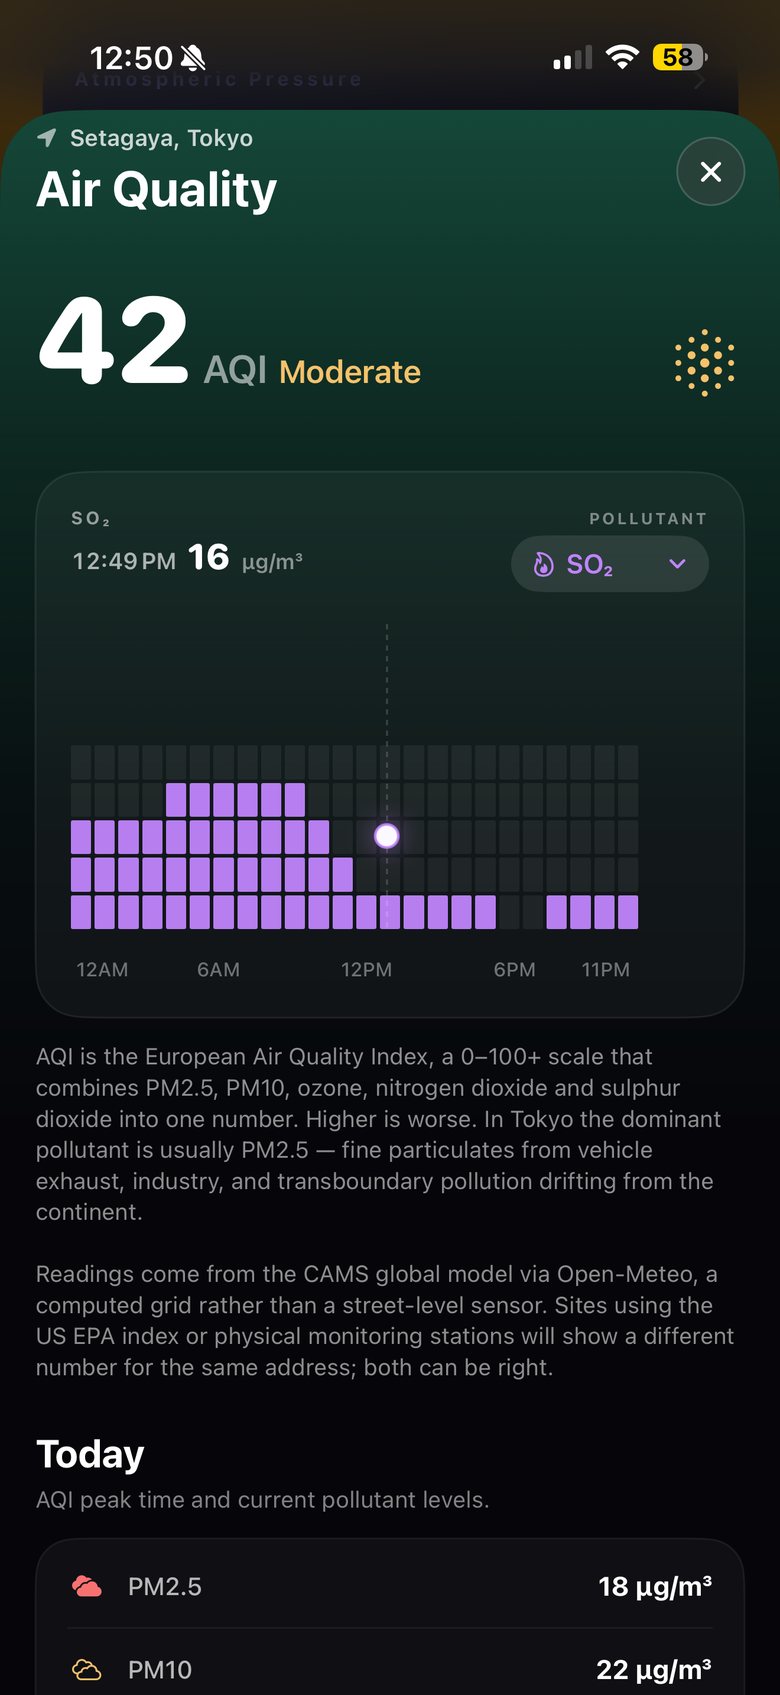
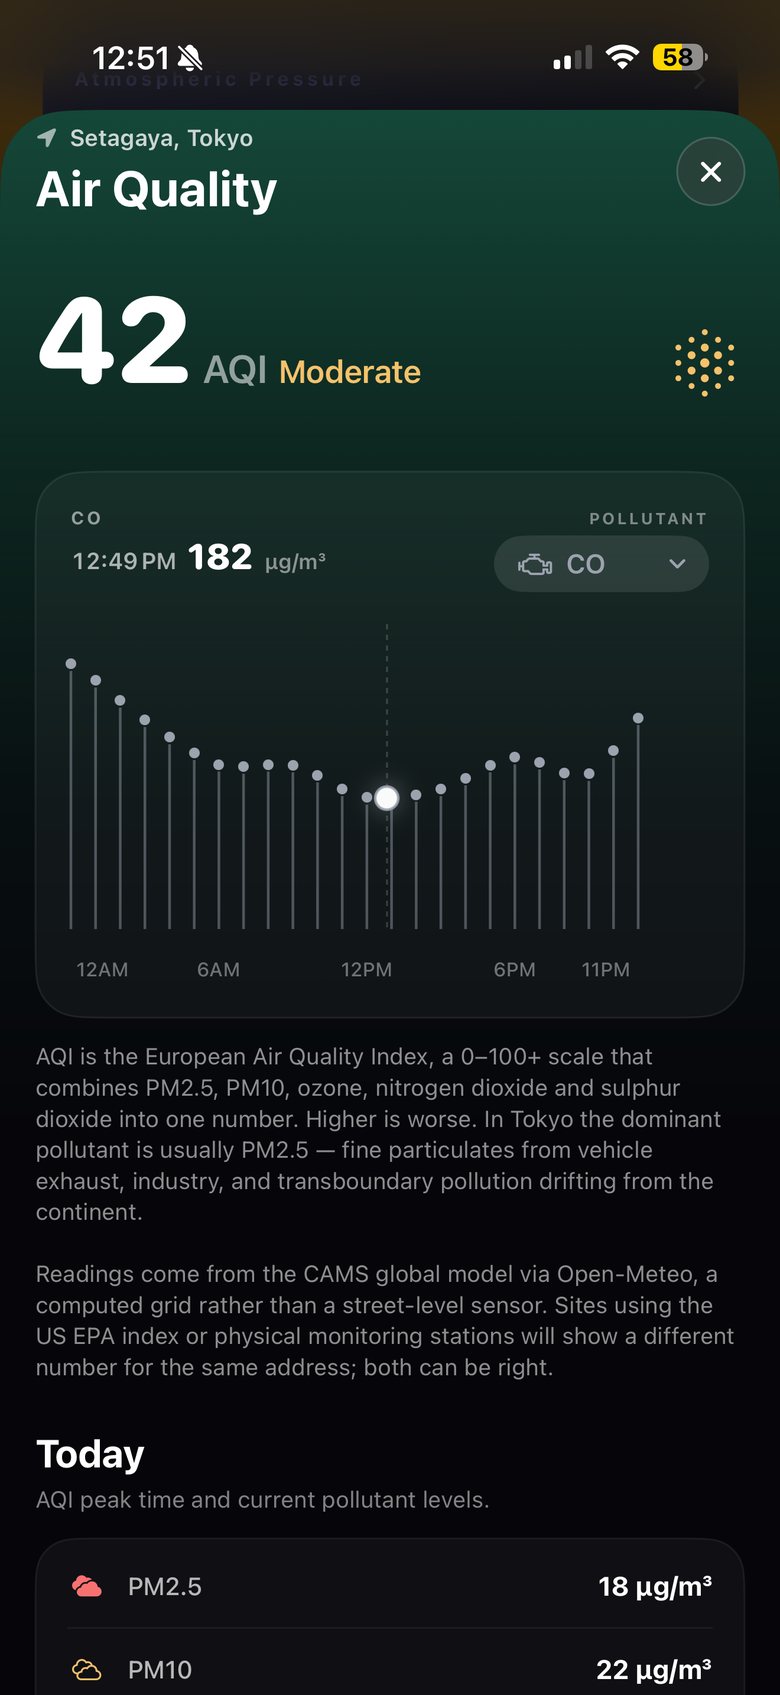
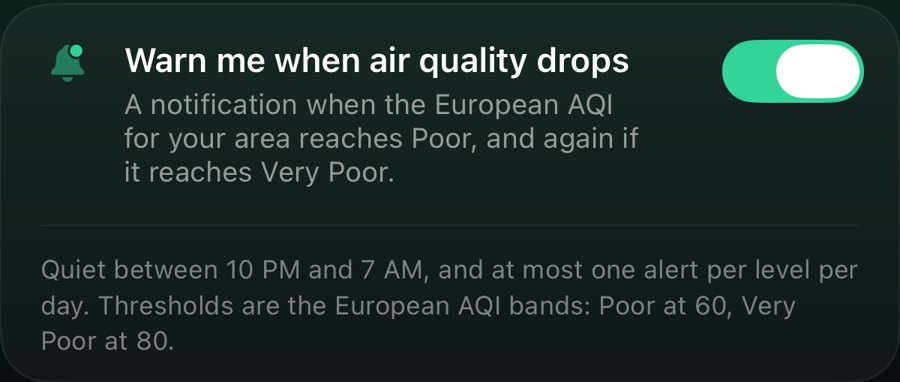
Switch on one toggle and SHINDO warns you when the European AQI for your area reaches Poor, and again at Very Poor. Never between 10 PM and 7 AM, and never more than once per level per day. Drag the index to try it.
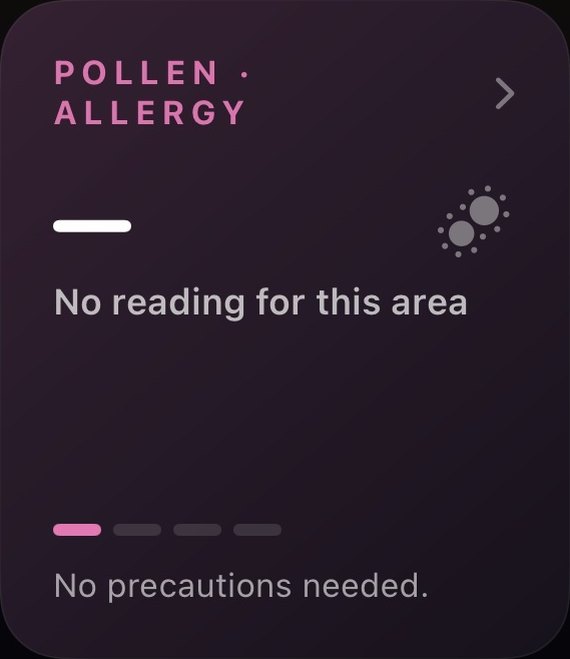
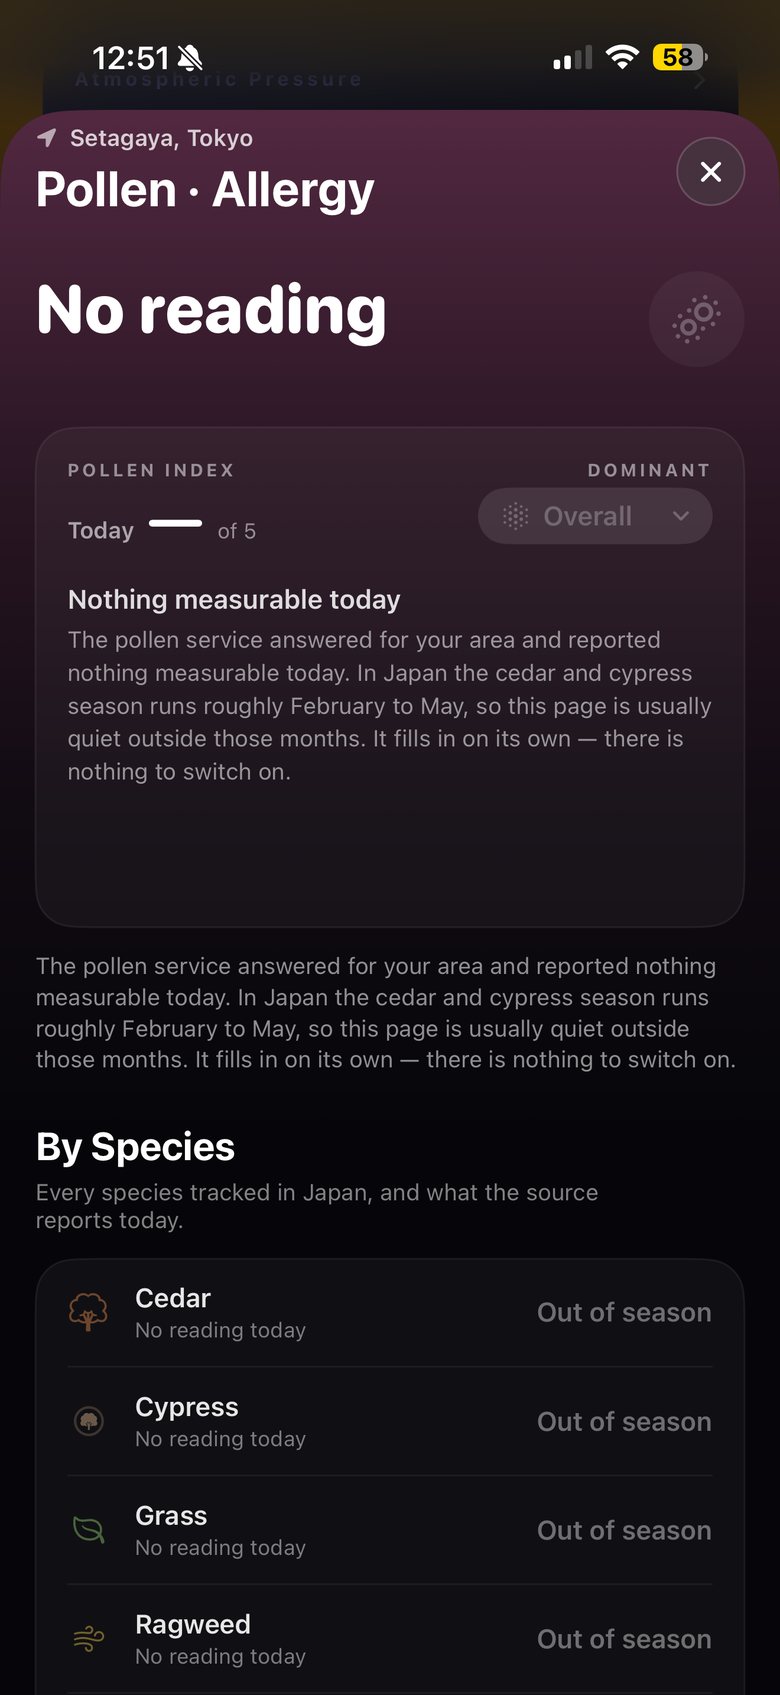
Cedar, cypress, grass, ragweed and mugwort — each reported separately on the 0–5 Universal Pollen Index for a 1 km area around you. Out of season, SHINDO says so plainly instead of showing a zero that looks like good news.
Wheel shows typical seasons in Japan, after the Ministry of the Environment's pollen manual: cedar and cypress in spring, grasses spring to early autumn, ragweed and mugwort late summer to autumn. Exact timing varies by year and region.
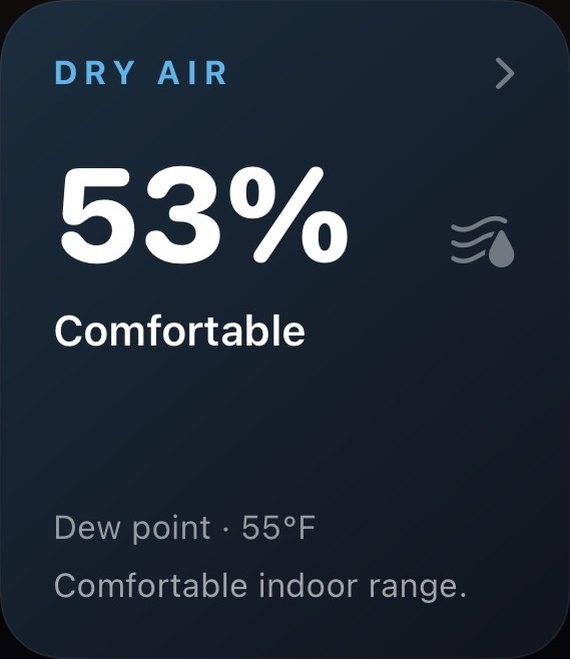
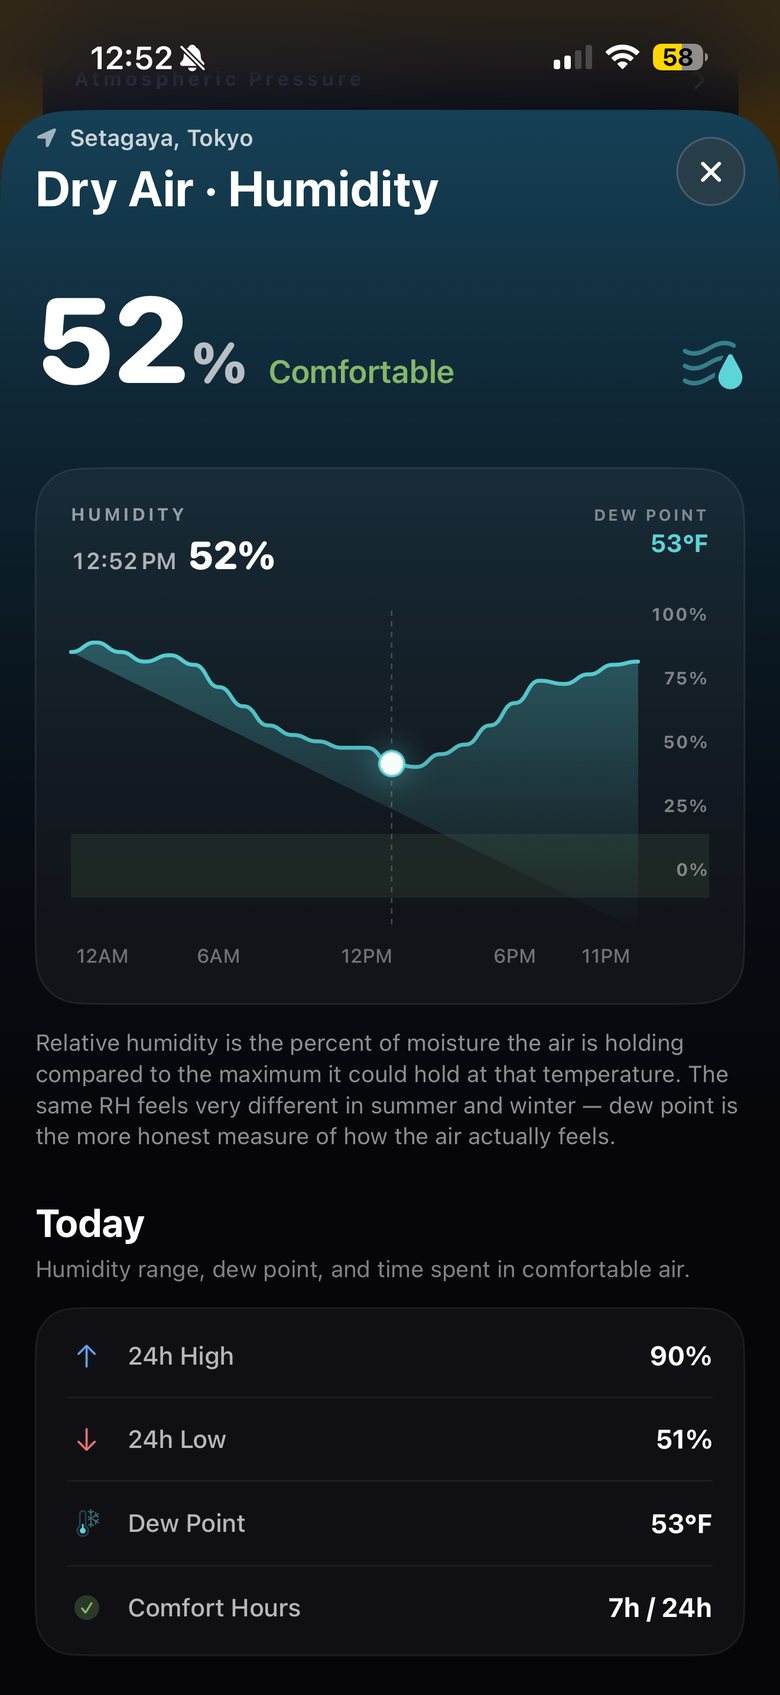
Relative humidity depends on temperature, so 52% in August and 52% in January feel nothing alike. SHINDO shows the dew point beside it — the more honest measure of how the air actually feels — plus today's range and how many hours sat in comfortable air.

UV index, air quality, pollutant concentrations and humidity: weather and air-quality data by Open-Meteo.com (CC BY 4.0), generated using Copernicus Atmosphere Monitoring Service (CAMS) information — a computed grid, not a street-level sensor. European AQI bands: Good 0–20, Fair 20–40, Moderate 40–60, Poor 60–80, Very poor 80–100, Extremely poor above 100. Pollen: Google Pollen API (Universal Pollen Index), pollen data © Google.
Screens show the SHINDO app on 18 October 2026, Setagaya, Tokyo; the four-card dashboard was captured a few minutes earlier than the detail screens. SHINDO gives general guidance, not medical advice — if you have asthma, allergies or another condition, follow your doctor's advice. All data sources.